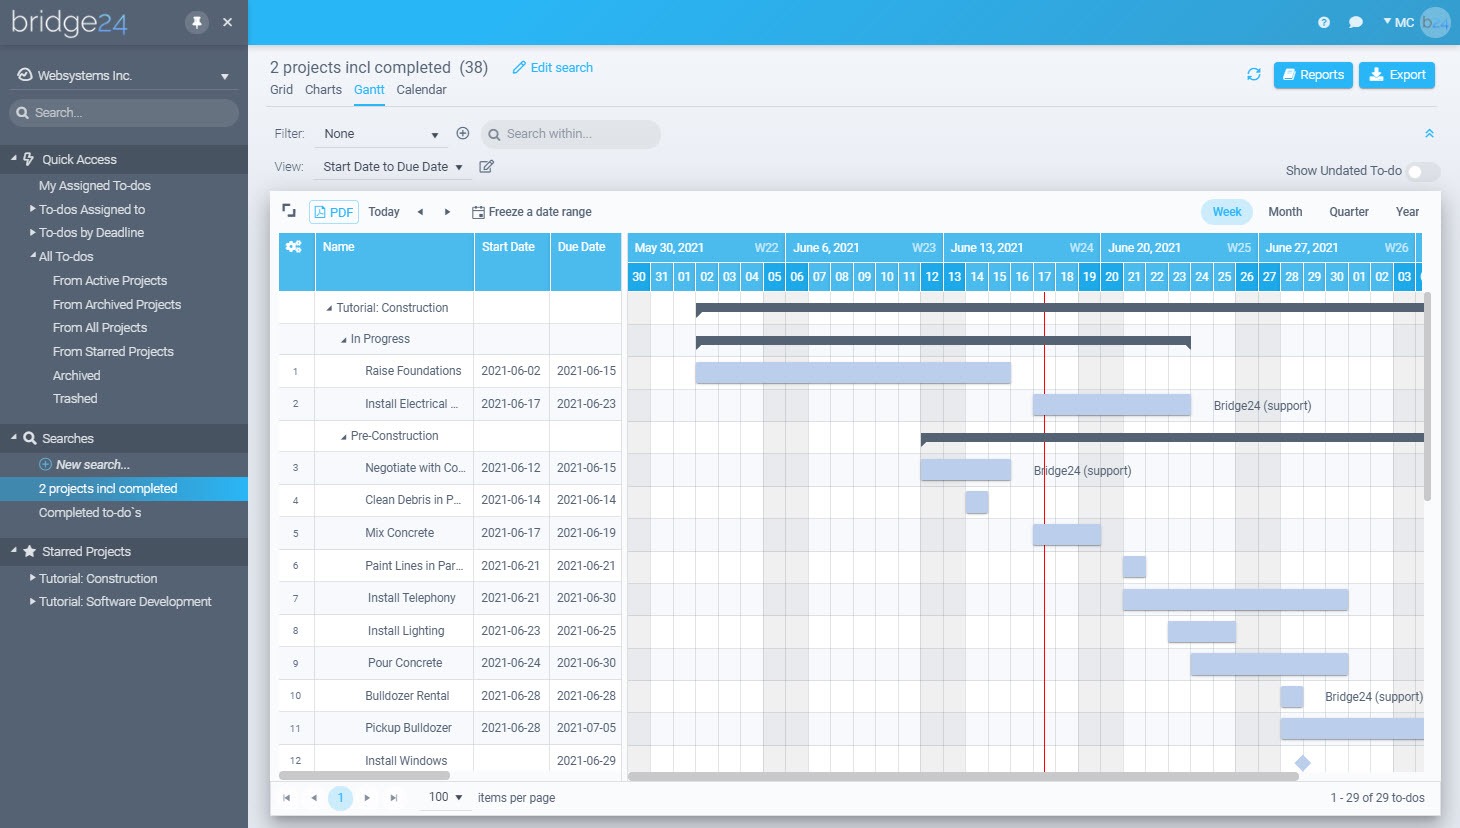
With the introduction of a Gantt Chart for Basecamp users, Bridge24 has recently provided a means to organize and visualize the progress of their projects, to-dos, and cards in a more structured and orderly way. This timeline view presents a complete picture of all to-dos across all projects, which enables users to monitor the progress of their projects more effectively. Additionally, the Gantt chart view features a dynamic filtering option that permits users to tailor the display to their specific requirements and only view the relevant projects, to-dos, and cards.
![]() If you feel Basecamp is currently above your budget, consider our tool AceProject, as an option. Our tool is not based on the number of users, which can save you a lot of money. Sign up for free to AceProject.
If you feel Basecamp is currently above your budget, consider our tool AceProject, as an option. Our tool is not based on the number of users, which can save you a lot of money. Sign up for free to AceProject.
Options for Gantt Chart in Basecamp
- Allows users to visualize their to-dos and cards using a dynamic Gantt Chart or Timeline view that spans across all their projects.
- Users can set any date fields as start and end dates for their to-dos and cards.
- Users can easily drag and drop progress bars within the Gantt Chart to update their to-do and card dates in real-time.
- Users can export their Gantt Chart view as a PDF to share or save for future reference.
- Basecamp’s Gantt Chart functionality enables users to group projects and lists and collapse them as needed for better organization.
- Users can quickly schedule to-dos that do not have dates by displaying them in the Gantt Chart.

Tailor your Gantt Chart to your needs using a wide range of date fields.
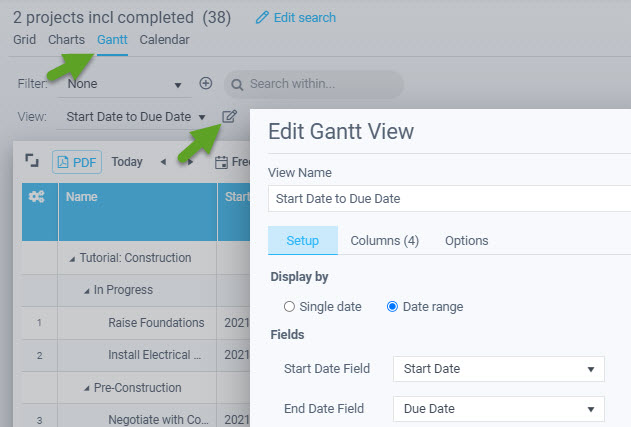
Gantt charts are essential for effective project planning as they allow users to track the progress of tasks over time, typically relying on the start and due dates of each task. However, Bridge24 provides users with the flexibility to utilize alternative dates such as “Last update,” “Completed at,” or “Created at” to fit their needs better.
Users can easily customize the Gantt chart by navigating to the Setup tab in the Edit Gantt View dialogue and selecting the desired start and end dates. This feature enables users to create a personalized and tailored chart, displaying the most relevant and valuable information for their projects.

Adjust Your Gantt Chart Timescale to Fit Your Needs
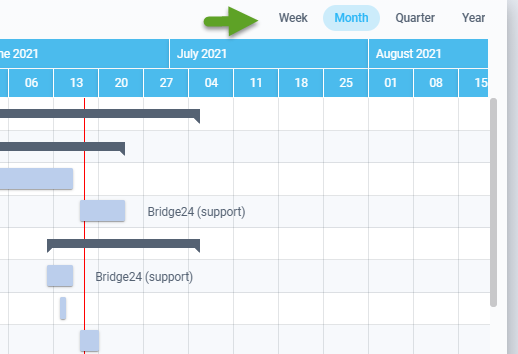
To customize the level of detail in their Gantt chart view, users can modify the timescale by selecting the desired option from the top-right corner of the chart. This feature includes weekly, monthly, quarterly, and yearly views, giving users the flexibility to adjust the chart according to their specific needs.
With this customization feature, users can focus on specific periods or gain a broader overview of their project’s timeline, providing them with increased visibility into their project’s progress. By tailoring the timescale to their requirements, users can more effectively track progress, identify potential issues, and stay on top of their project’s timelines and deadlines.

Conclusion
Basecamp’s Gantt chart functionality offers users a well-organized and visually clear representation of their project’s progress, allowing them to track tasks and timelines efficiently. With the ability to customize the Gantt chart view by using different dates and timescales and filtering data dynamically, Basecamp users benefit from a flexible and invaluable tool.
Users have embraced the integration of the Gantt chart feature in Basecamp, citing a more user-friendly and comprehensive project view. In summary, Bridge24’s inclusion of the Gantt chart in Basecamp represents a significant step forward, empowering users with the necessary tools to manage their projects efficiently.
Leave A Comment